AI Search Citations: How Much Do They Really Change Week to Week?
BrightEdge data reveals AI engines are consolidating — not redistributing — citations. The core is remarkably stable. But when changes happen, they're sudden, binary, and overwhelmingly downward.
We track thousands of prompts across ChatGPT, Gemini, Google AI Mode, Google AI Overviews, and Perplexity every week, spanning nine industries. This week we asked a fundamental question: how volatile are AI search citations really? Are the sources AI engines cite and mention changing constantly — or are they more stable than people think?
The answer is encouraging — with an important caveat.
Data Collected
Using BrightEdge AI Catalyst™, we analyzed citation and mention behavior across all five major AI engines to understand::
- How many domains saw week-over-week changes in citation share
- Whether changes skewed toward gains or losses
- How volatility correlates with citation volume and industry
- Whether brand mentions and citations are moving in the same direction
- The relationship between mention rank position and stability
Key Finding
AI search is consolidating, not redistributing. The vast majority of citations are stable week to week — but when changes happen, they're overwhelmingly losses.
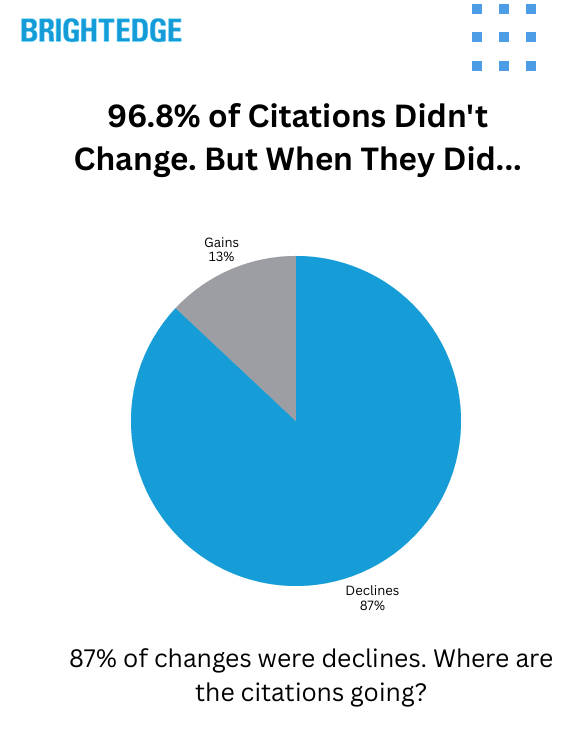
96.8% of cited domains saw zero change week over week. Among the roughly 3% that did move, 87% were declines. Only 13% were gains. And those changes weren't gradual — most were binary, with domains going from cited to not cited at all on a given prompt.
Over 51% of all citation volume was associated with declining domains. Only about 5% was associated with growing ones. The losses aren't being redistributed to new winners. They're disappearing. AI engines are tightening their citation radius — getting more selective about what they link to, not swapping one source for another.
The Stability Story: How Locked In Is the Core?
The headline numbers paint a clear picture of stability:
| Metric | This Week |
| Citations — % of domains with zero change | 96.8% |
| Mentions — % of brands with zero change | 97.2% |
| Top-ranked brands (#1 or #2 position) — % with zero change | 99.4% |
If a domain is part of the trusted citation set for a given prompt, it tends to stay there. And the higher you rank, the more durable your position. Brands in the #1 or #2 mention position are nearly cemented — only 0.6% saw any movement.
That stability drops as you move down the rankings:
| Mention Rank Position | % That Changed | Avg Change |
| Top ranked (1–2) | 0.6% | 0.6% |
| Mid ranked (2–4) | 4.1% | 3.1% |
| Lower ranked (5+) | 3.0% | 2.3% |
The core holds. The volatility lives in the middle and tail positions.
But When Things Change, They Go Down — Fast
Among the ~3% of domains that did see citation changes this week, the direction was overwhelmingly one-sided:
| Direction | % of Changes | Share of Citation Volume |
| Declining | 87% | 51.3% |
| Growing | 13% | 5.3% |
| No change | — | 43.5% |
Most changes were binary. Domains didn't gradually lose a few percentage points of citation share — they went from being cited to not being cited at all on a given prompt. Only about 0.4% of all tracked domains gained new citations this week.
This means the losses aren't flowing to new winners. AI engines are pruning their citation sets without proportional replacement. The citation radius is tightening.
The Core vs. Fringe Dynamic: Why Bigger Footprints See More Churn
At first glance, the data seems counterintuitive: domains with larger citation footprints are more likely to see week-over-week changes. But this makes perfect sense once you understand the two-zone dynamic.
Think of any domain's citation footprint as two zones:
- The core — prompts where it's consistently the best source. Rock solid.
- The fringe — prompts where it's borderline relevant, maybe the 8th or 9th best answer. This is where the churn happens.
A domain cited on just a handful of highly specific prompts is almost certainly there because it's genuinely the best source — there's no fringe zone. A domain cited across thousands of prompts inevitably has a margin of borderline inclusions that can rotate in or out weekly.
The data confirms this:
| Domain Tier | % That Changed | Typical Fringe Size |
| Highest-volume domains (top 50) | 90% | ~5% of citation share |
| Domains with 100+ citations | 65.2% | ~17% of citation share |
| Top 10% by volume | 21.1% | Larger shifts |
| Bottom 50% by volume | 0.4% | Minimal |
Among the very biggest domains, 90% have a fringe — but it's typically only about 5% of their total citation share that's in play any given week. For mid-tier domains with solid footprints, that fringe widens to around 17%.
The core holds. It's the edges that get trimmed.
Citation Concentration: The Rich Get Richer
AI search citations are heavily concentrated among a small number of domains:
| Domain Percentile | Share of All Citations |
| Top 1% | 64% |
| Top 5% | 78% |
| Top 10% | 84% |
Mentions are slightly less concentrated but still steep:
| Brand Percentile | Share of All Mentions |
| Top 1% | 44.5% |
| Top 5% | 62.3% |
| Top 10% | 69.6% |
This concentration, combined with the pruning trend, means the barrier to entry is high and rising. Only 0.4% of domains gained new citations this week. The door in is narrow.
Not All Industries Churn Equally
Citation volatility varies significantly by industry vertical and website type.
Citation Volatility by Website Type
| Website Type | % of Domains That Changed | % of Changes That Were Declines |
| Finance | 51.1% | 91% |
| Review Sites | 45.5% | 100% |
| News/Media | 44.8% | 92% |
| Reference/Encyclopedia | 38.5% | 80% |
| Health/Medical | 34.2% | 100% |
| Video Platforms | 33.3% | 100% |
| eCommerce/Retail | 23.1% | 73% |
| Tech | 15.2% | 91% |
| Government/Institutional | 3.6% | 77% |
Finance sites are the most volatile — over half of tracked finance domains saw citation changes, with 91% of those being declines. Financial data sites, market trackers, and investment research platforms are experiencing the most pruning.
Review sites and news/media follow closely, both skewing heavily negative. Health/medical sites are notable: while "only" 34% changed, 100% of those changes were declines.
eCommerce/retail was the most balanced category, with the highest proportion of positive changes (27% of changes were gains). Government and institutional sites were the most stable at under 4% — when AI engines trust a .gov source, that trust holds.
The Emerging Split: Being Mentioned ≠ Being Cited
One of the most striking patterns this week was the divergence between mentions and citations. Multiple website categories saw their citations drop significantly while their mentions actually increased.
| Website Type | Citation Trend | Mention Trend |
| Social platforms | Large declines (-34% to -45%) | Gains (+11% to +18%) |
| Financial data/analysis sites | Steep declines (-35% to -57%) | Gains (+20% to +65%) |
| Reference/dictionary sites | Declines (-33% to -40%) | Gains (+27% to +67%) |
| Video platforms | Significant decline | Gains (+18%) |
| Review/editorial sites | Declines (-33% to -50%) | Gains (+20% to +25%) |
AI engines are still talking about these sources by name — referencing them in the body of their answers — but increasingly choosing not to link to them.
This suggests that brand authority and citation authority are becoming two different things in AI search. You can be well-known to the models without earning the link. Being mentioned is not the same as being cited — and the gap is growing.
Prompt Landscape: What AI Engines Are Being Asked
While the prompt data doesn't allow week-over-week comparison, it reveals important structural patterns about how AI search works across industries.
Intent Distribution by Industry
| Industry | Consideration | Informational | Transactional |
| eCommerce | 61.5% | 23.1% | 15.2% |
| Travel | 39.5% | 56.6% | 3.9% |
| Finance | 28.1% | 31.4% | 39.9% |
| Restaurants | 27.9% | 33.4% | 38.7% |
| Insurance | 26.5% | 65.8% | 7.7% |
| Education | 22.3% | 75.4% | 2.2% |
| B2B Tech | 14.2% | 76.5% | 8.9% |
| Entertainment | 7.3% | 83.4% | 9.4% |
| Healthcare | 4.3% | 94.2% | 1.5% |
Healthcare is overwhelmingly informational (94.2%) — people are researching symptoms and conditions. eCommerce is majority consideration (61.5%) — people are shopping and comparing. Finance is the most evenly split across all three intents.
Competitive Density by Industry
| Industry | Avg Brands Mentioned Per Prompt | Avg URLs Cited Per Prompt |
| Travel | 26.2 | 24.7 |
| Education | 17.0 | 24.8 |
| Restaurants | 16.4 | 15.9 |
| eCommerce | 16.0 | 16.8 |
| B2B Tech | 14.8 | 20.2 |
| Insurance | 13.4 | 20.4 |
| Finance | 11.4 | 15.1 |
| Healthcare | 11.1 | 21.2 |
| Entertainment | 10.9 | 12.5 |
Travel is the most crowded vertical — an average of 26.2 brands mentioned per prompt and 24.7 URLs cited. If you're competing in travel, the AI answer landscape is significantly more congested than any other industry.
Healthcare shows a unique pattern: relatively few brands per prompt (11.1) but a high URL citation count (21.2). AI engines cite lots of medical sources — medical centers, government health agencies, research databases — but mention fewer commercial brands.
How Citations and Mentions Differ by Intent
| Intent Type | Avg Mentions Per Prompt | Avg Citations Per Prompt |
| Informational | 19.1 | 35.2 |
| Consideration | 27.4 | 29.2 |
| Transactional | 19.0 | 24.6 |
Informational prompts generate nearly twice as many citations as mentions — AI engines are linking to more sources when explaining concepts. Consideration prompts bring mentions closer to citations — brands get named when users are comparing options. Transactional prompts generate the fewest citations — AI engines are more direct when users are ready to act.
What This Means for Your AI Search Strategy
1. If You're in the Core, You're in a Strong Position
97% of citations didn't change this week. Positions at the top of the mention rankings are especially durable — 99.4% of #1 and #2 positions held. If you've built strong AI search presence, that investment is paying off with real stability.
2. But Changes Are Binary — Monitor Before They Happen
Domains don't slowly lose citation share over weeks. They go from cited to not cited in a single cycle. There's no gradual warning. Understanding where you sit — core vs. fringe — on each prompt is how you stay ahead of shifts rather than reacting to them.
3. AI Engines Are Getting More Selective, Not Shifting Preferences
The pruning trend means AI engines are tightening around fewer trusted sources. Losses aren't flowing to competitors. This makes existing positions more valuable — and makes breaking in harder for newcomers. Only 0.4% of domains gained new citations this week.
4. Brand Awareness Isn't Enough — You Need Citation Authority
The growing gap between mentions and citations means being known to AI engines doesn't automatically earn you the link. Optimizing for citation visibility — not just brand mentions — is increasingly important as the two diverge.
5. Know Your Industry's Volatility Profile
Finance and news/media domains face significantly more churn than eCommerce or government sites. If you're in a high-volatility category, monitoring your fringe positions is especially critical — that's where the pruning is happening fastest.
Technical Methodology
Data Source: BrightEdge AI Catalyst™
Analysis Period: Week of February 1, 2026 (week-over-week comparison)
AI Engines Tracked: ChatGPT, Gemini, Google AI Mode, Google AI Overviews, Perplexity
Industries Covered: eCommerce, Healthcare, Finance, Travel, B2B Tech, Entertainment, Education, Restaurants, Insurance
Metrics Analyzed:
- Citation share of voice and week-over-week change by domain
- Mention share and week-over-week change by brand
- Brand average mention rank position
- Prompt intent classification (Informational, Consideration, Transactional)
- Brand and URL density per prompt by industry
Website Type Classification: Domains categorized by type (Finance, Health/Medical, eCommerce/Retail, News/Media, Tech, Government/Institutional, Social/UGC, Video, Review Sites, Reference/Encyclopedia, Travel, Entertainment) based on domain characteristics.
Key Takeaways
AI Search Citations Are Remarkably Stable: 96.8% of cited domains and 97.2% of mentioned brands saw zero change week over week. Top-ranked positions (#1 and #2) are nearly locked in at 99.4% stability.
But When Changes Happen, They're Overwhelmingly Losses: 87% of citation changes were declines. Over 51% of citation volume was associated with declining domains, vs. only 5% with growing ones. Changes are binary — domains drop out entirely rather than fading gradually.
AI Is Consolidating, Not Redistributing: Losses aren't flowing to new winners. AI engines are pruning borderline citations without replacement, tightening around a smaller set of trusted sources. Only 0.4% of domains gained new citations.
Bigger Footprints Have Bigger Fringes: The highest-volume domains are most likely to see changes, but those changes typically affect only ~5% of their citation share. Mid-tier domains see wider fringe exposure (~17%). The core is stable; it's the edges that churn.
Finance Is the Most Volatile Category: 51% of finance domains saw citation changes (91% declines). Review sites, news/media, and health/medical follow. Government sites are the most stable at under 4%.
Brand Mentions and Citations Are Diverging: Multiple categories saw citations decline while mentions increased. AI engines are naming brands without linking to them. Brand authority and citation authority are becoming two separate things.
18 Months of AI Overviews: What Healthcare Tells Us About Where Finance Is Headed
BrightEdge data reveals Google uses the same YMYL playbook for both industries. The difference isn't how Google treats them — it's how people search.
Download the Full Report
Download the full AI Search Report — AI Search Citations: How Much Do They Really Change Week to Week?
Click the button above to download the full report in PDF format.
Published on February 6, 2026